Comparing K-Means and others algorithms for data clustering - Part 4
In this post, we will witness the most widely used clustering algorithm in action and assess its sensitivity to outliers and irregular shapes.
What is K-Means ?
K-Means is a popular clustering algorithm used in machine learning and data analysis. It belongs to the category of partitioning methods and is designed to partition a dataset into a specific number of clusters (K), where each data point belongs to the cluster with the nearest mean. The algorithm iteratively refines its clusters by assigning data points to the cluster with the closest centroid and updating the centroids based on the mean of the assigned points.
The basic steps of the K-Means algorithm are thus as follows. Note that we have utilized images from Wikipedia.
- Initialize
- Assign
- Update
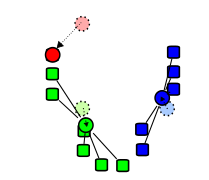
- Repeat
The centroid $C$ of a cluster is the arithmetic mean of all the data points in that cluster.
Mathematically, in our case, for a cluster with $n$ data points, $C=(\dfrac{1}{n}\displaystyle\sum_{i=1}^nX_{i}, \dfrac{1}{n}\displaystyle\sum_{i=1}^nY_{i})$.
Here, $X_{i}$ represents the first dimension of the $i$-th data point in the cluster and $Y_{i}$ is the second dimension of the $i$-th data point.
The initialization of points in K-Means is not entirely random; rather, it aims to choose points in a way that is likely to distribute the $K$ points across different clusters. Various techniques exist for this purpose, but we won't delve into the details of these techniques here. Interested readers can refer to the implemented code.
In real-world scenarios, it is common practice to normalize data before processing it.
Implementation in C#
As mentioned in the previous post, we need to implement the IClusteringStrategy interface.
 1public class KMeansClusteringStrategy : IClusteringStragtegy
 2{
 3    public KMeansClusteringStrategy()
 4    {
 5        // DI: Inject distance in a real-world scenario
 6    }
 7
 8    public List<DataCluster> Cluster(Dataset set, int clusters)
 9    {
10        var groups = Initialize(set, clusters);
11        while (true)
12        {
13            var changed = false;
14            foreach (var point in set.Points)
15            {
16                var currentCluster = groups.FirstOrDefault(t => t.Points.Any(x => x == point));
17                if (currentCluster == null) changed = true;
18
19                var d = double.MaxValue; DataCluster selectedCluster = null;
20                foreach (var group in groups)
21                {
22                    var distance = point.ComputeDistance(group.GetCentroid());
23                    if (d > distance)
24                    {
25                        selectedCluster = group;
26                        d = distance;
27                    }
28                }
29
30                if (selectedCluster != currentCluster)
31                {
32                    selectedCluster?.Points.Add(point);
33                    currentCluster?.Points.Remove(point);
34                    changed = true;
35                }
36            }
37
38            if (!changed) break;
39        }
40
41        return groups;
42    }
43
44    #region Private Methods
45
46    private List<DataCluster> Initialize(Dataset set, int clusters)
47    {
48        var results = new List<DataCluster>();
49
50        var selectedPoints = new List<DataPoint>();
51
52        var r = new Random(); var k = r.Next(set.Points.Count);
53        var p = set.Points.ElementAt(k); selectedPoints.Add(p);
54
55        var c = 1;
56        var cluster = new DataCluster() { Cluster = c.ToString(), Points = new List<DataPoint>() { p } };
57        results.Add(cluster);
58
59        while (c < clusters)
60        {
61            var remainingPoints = set.Points.Except(selectedPoints).ToList();
62            var maximum = double.MinValue; DataPoint other = null;
63            foreach (var point in remainingPoints)
64            {
65                var distance = selectedPoints.Select(x => x.ComputeDistance(point)).Min();
66                if (distance > maximum)
67                {
68                    maximum = distance;
69                    other = point;
70                }
71            }
72
73            selectedPoints.Add(other);
74
75            c++;
76            var newCluster = new DataCluster() { Cluster = c.ToString(), Points = new List<DataPoint>() { other } };
77            results.Add(newCluster);
78        }
79
80        return results;
81    }
82
83    #endregion
84}
K-Means is renowned for its simplicity, as evident in the preceding code with only a few lines. Undoubtedly, this simplicity contributes to its widespread use. On our part, we will explore how this algorithm performs on our three datasets.
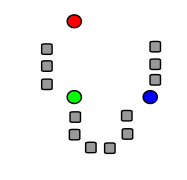
Results for the first dataset
Keep in mind that the first dataset is purely academic and serves as a straightforward test to ensure the algorithm functions on simple cases.

We can observe that, as expected, the clusters are perfectly identified and there is nothing additional to note regarding this specific case.
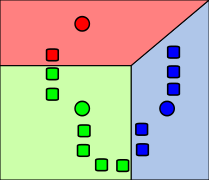
Results for the second dataset
The second dataset is employed to illustrate the impact of outliers.

This result prompts further commentary. Despite having only two outliers (albeit exaggerated), the algorithm appears to struggle. This underscores one of the key insights from this series: K-Means is highly sensitive to outliers, and a robust preprocessing step, specifically designed for outlier detection, should be implemented before applying this method indiscriminately.
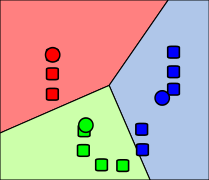
Results for the third dataset
The third dataset is used to demonstrate how the algorithm performs in more challenging or pathological cases.
In this case, there are two clusters (not three, as before).

Once again, this result prompts further comments: K-Means struggles significantly with irregular shapes or data that is not linearly separable. This characteristic can pose a challenge. In our figure, it is relatively easy to discern that the data is pathological, but in real-world scenarios with very high dimensions, visualizing this fact becomes more challenging. We need to trust our understanding of the problem at hand to ensure that we can apply K-Means and obtain accurate results.
K-Means is easy to comprehend and implement, performing efficiently when dealing with simple and spherical clusters. However, it has limitations:
- It is highly sensitive to outliers.
- It requires a predefined number of clusters as input.
- It is not well-suited for datasets with irregular shapes.
Can we improve and address some of the limitations mentioned here ? This is the topic of the next article dedicated to hierarchical clustering.